RiskGraph · Our internal research platform

How We Model Risk Pathways

A threat model should show how harm could happen, what supports that account and what could change our minds. We use RiskGraph internally to structure that reasoning, examine evidence and guide our research. This walkthrough shows how we work.

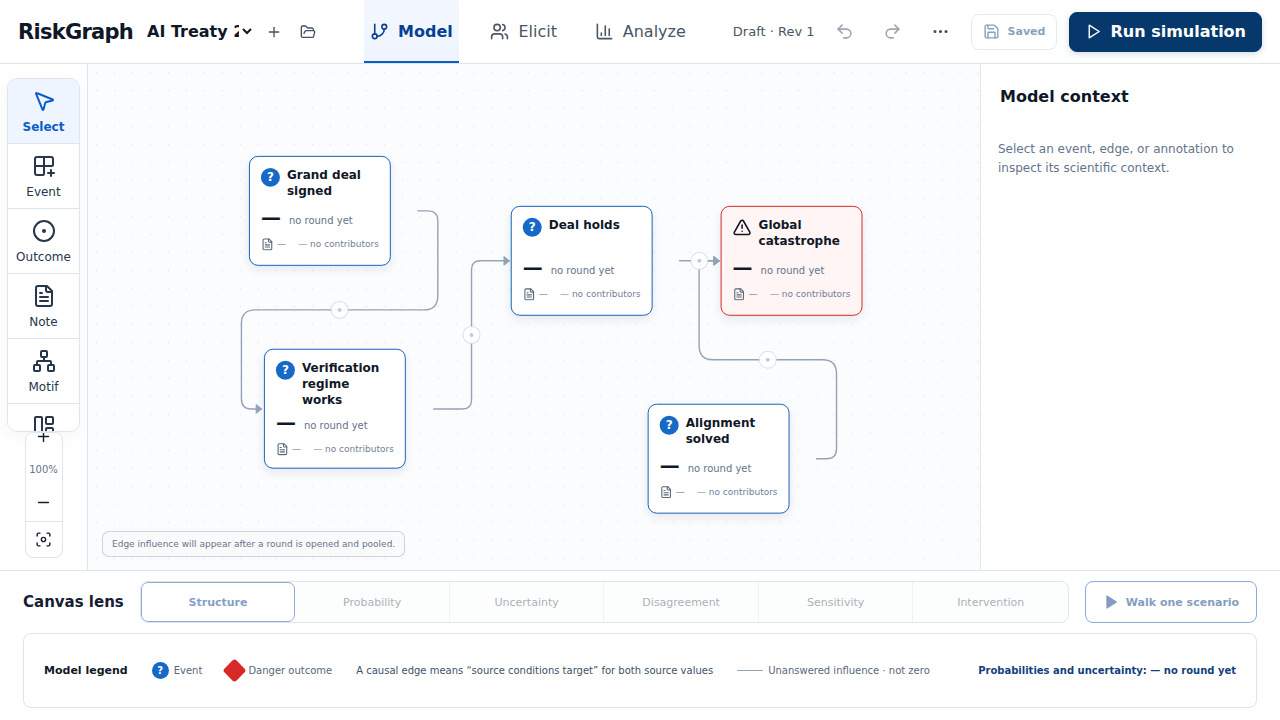
RiskGraph tutorial with five connected events, from a treaty and verification to a catastrophe outcome View full size ↗
Start with an explicit structure. Each event and connection is a claim to examine; drawing an arrow does not establish causation. The example models the verified-slowdown scenario from AI 2040 by the AI Futures Project, for illustration only. Inside COAI’s internal RiskGraph platform · illustrative example, not a research result.

As a method

Events and dependencies

Define events, trace dependencies and compare explanations. Keep assumptions separate from evidence.

As a tool

Expert judgments and uncertainty

Collect judgments, preserve disagreement and explore what a model implies under stated assumptions.

As a platform

Evidence and revisions over time

Keep model revisions, evidence, study rounds and analysis provenance connected across a research programme.

How we work

How we use RiskGraph, step by step

Our internal workflow follows five steps: model, elicit judgments, pool them, simulate the probabilistic model and read the results. Our research loop continues by reviewing evidence and revising the model.

01 / Define a claim

Defining the events

A node needs a clear statement, a time horizon and resolution criteria. Conditional questions make dependencies explicit. Definitions are frozen within study rounds so changed wording cannot silently inherit old answers.

Evidence dossiers connect a claim to sources and explain their relevance and limitations. A source can inform a model without resolving an event or establishing its probability.
02 / Challenge the assumptions

Collecting expert judgments

Collect probability judgments with reasons, counterarguments and “cannot assess” responses. Human contributors and AI model families remain distinct groups; explicit weights govern how their judgments are combined.

A pooled distribution can retain competing views. An argument map makes the reasons behind those views available for review.

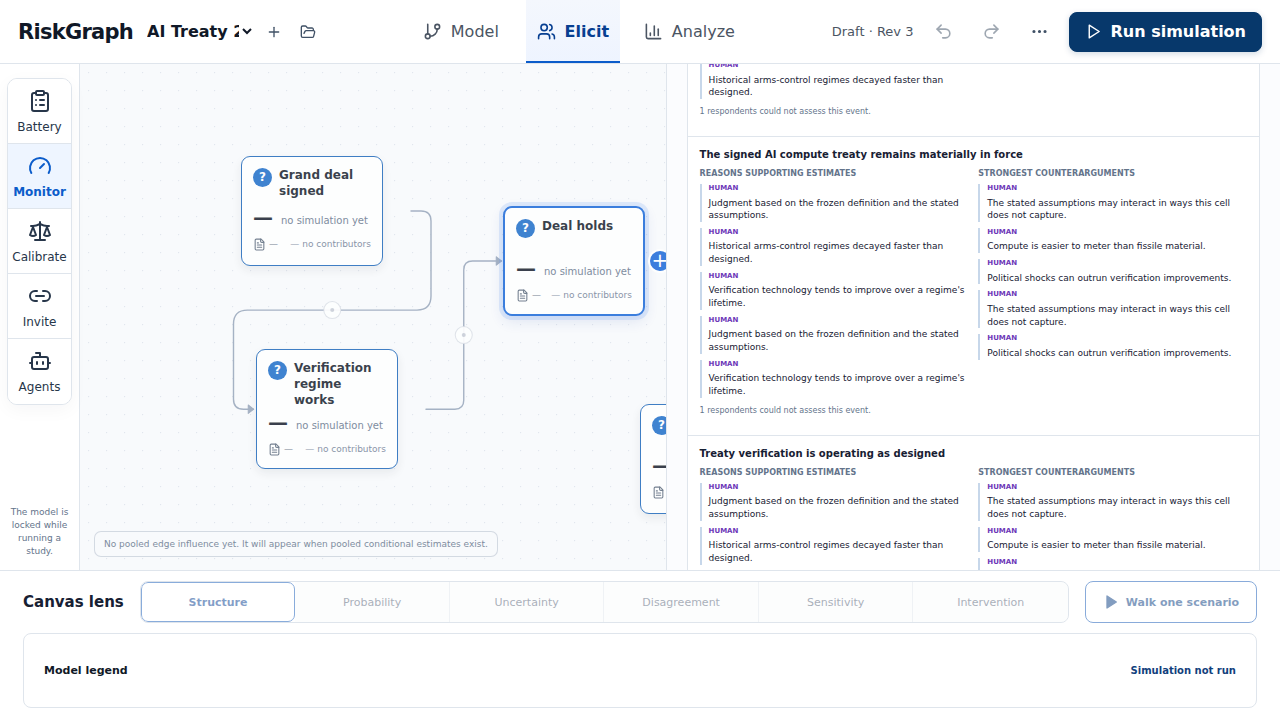
RiskGraph argument map showing supporting reasons, strongest counterarguments and cannot-assess responses beside a graph View full size ↗
Read the reasoning behind a judgment. Agreement alone is not evidence that an assumption is sound. The judgments shown come from LLM personas used to test the workflow; in this test round they were recorded as the human group. Inside COAI’s internal RiskGraph platform · illustrative example, not a research result.

03 / Compare model implications

Comparing scenarios

Compare a baseline with an observation or a modeled intervention. These answer different questions. RiskGraph separates them and requires a causal review before enabling intervention analysis.

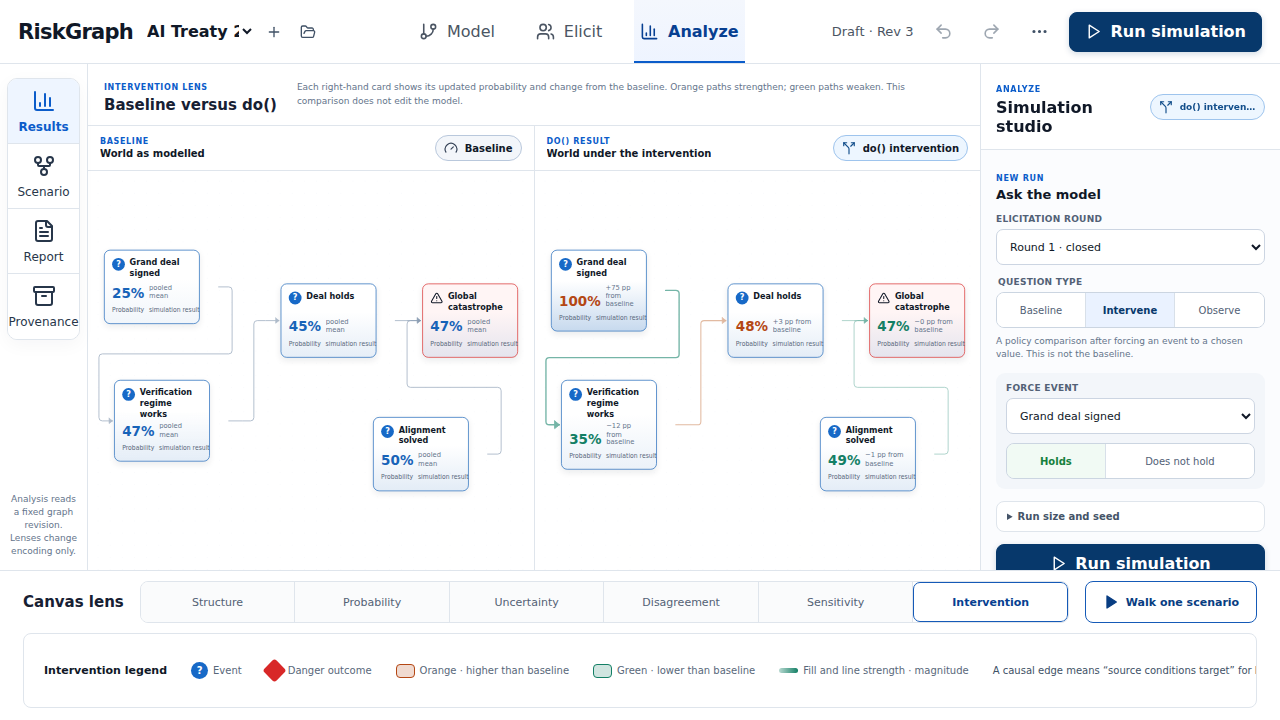
RiskGraph baseline and modeled intervention displayed side by side with different outcome probabilities View full size ↗
Compare scenarios under explicit assumptions. Every number here belongs to the illustrative treaty example shown here; none is an estimate of COAI’s research outcomes or real-world catastrophic risk. Inside COAI’s internal RiskGraph platform · illustrative example, not a research result.

Baseline

What follows from this model and its current inputs?

Observation

What changes if we learn that an event occurred? Other connected events can become more or less plausible.

Modeled intervention

What follows if we force an event and sever its incoming causal links? This depends on the validity of the causal model.

RiskGraph propagates uncertainty through an event graph; it does not run agents. Whether a system obeys a stop signal is tested in a separate executing environment.

04 / Read, test and revise

Reading and revising the results

Inspect the model revision, study-round provenance and simulation settings behind a result. Read the uncertainty alongside the number, then identify which assumption would most benefit from stronger evidence.

Evaluation findings, literature and counterevidence can motivate a reviewed revision. Updating a model is a reviewed scientific judgment.

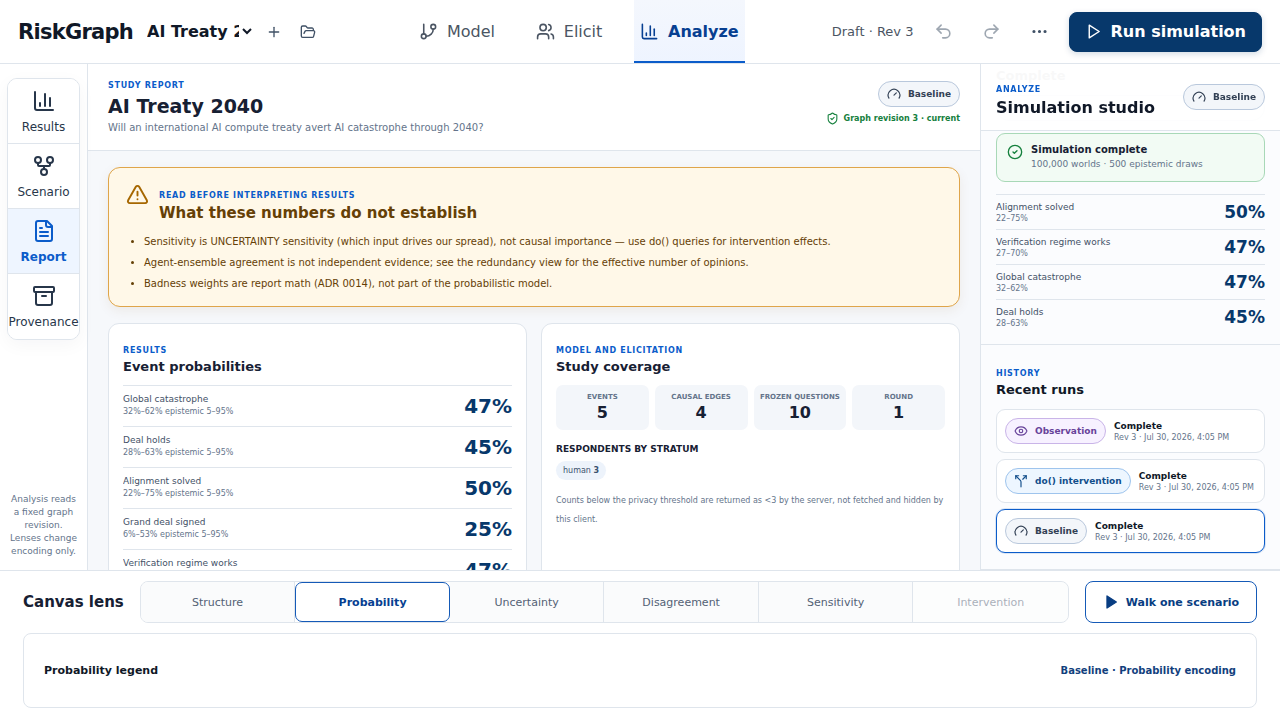
RiskGraph report with analysis provenance, outcome ranges and an explicit section on what the numbers do not establish View full size ↗
Keep the scope of inference attached to the result. The report distinguishes model output from claims the analysis cannot establish. Its figures come from a test round with three LLM personas, listed as human respondents; they are not expert estimates. Inside COAI’s internal RiskGraph platform · illustrative example, not a research result.
Risk hypothesisConsequential uncertaintyTargeted evidenceReviewed model revision

A platform for cumulative research

The research record

Within COAI, RiskGraph’s project library and institute map connect individual models to broader research questions. Source links, adoption records and revision signals make it possible to inspect where an assessment came from and when it needs attention during internal review.

Coverage gaps, disagreement and uncertainty help identify where further work may be useful. They are signals for research judgment, not a single score of scientific quality.

What a research record contains

  • A defined claim and versioned model
  • Sources, assumptions and counterarguments
  • Judgments with contributor-group provenance
  • Uncertainty and limits of inference
  • A concrete question for the next review

Cross-project links do not automatically preserve correlations or make separate models valid to combine. Composition needs its own review.

From method to evidence

Research that uses this method

Our STPA analysis of human oversight of a swarm of agents is set up as a RiskGraph model. Our monitoring pilot supplies evidence for one of its nodes: whether a violation is noticed in time.